
Your pipeline generates a report, shares it with a third-party partner, and a few hours later, you hear back that your data is incomplete. That gives a bitter aftertaste.
Monitoring what did not happen is as important as monitoring what did, and it’s often missed. It’s common to receive an alert when an Airflow pipeline fails, but it’s much less common to receive one when a pipeline doesn’t run. Same with missing data. These quiet failures quickly degrade dataset quality and are often discovered by end users rather than the engineering team, undermining trust.
A common challenge
When I think about quiet failures, it always reminds me of a production incident I had to handle in the past.
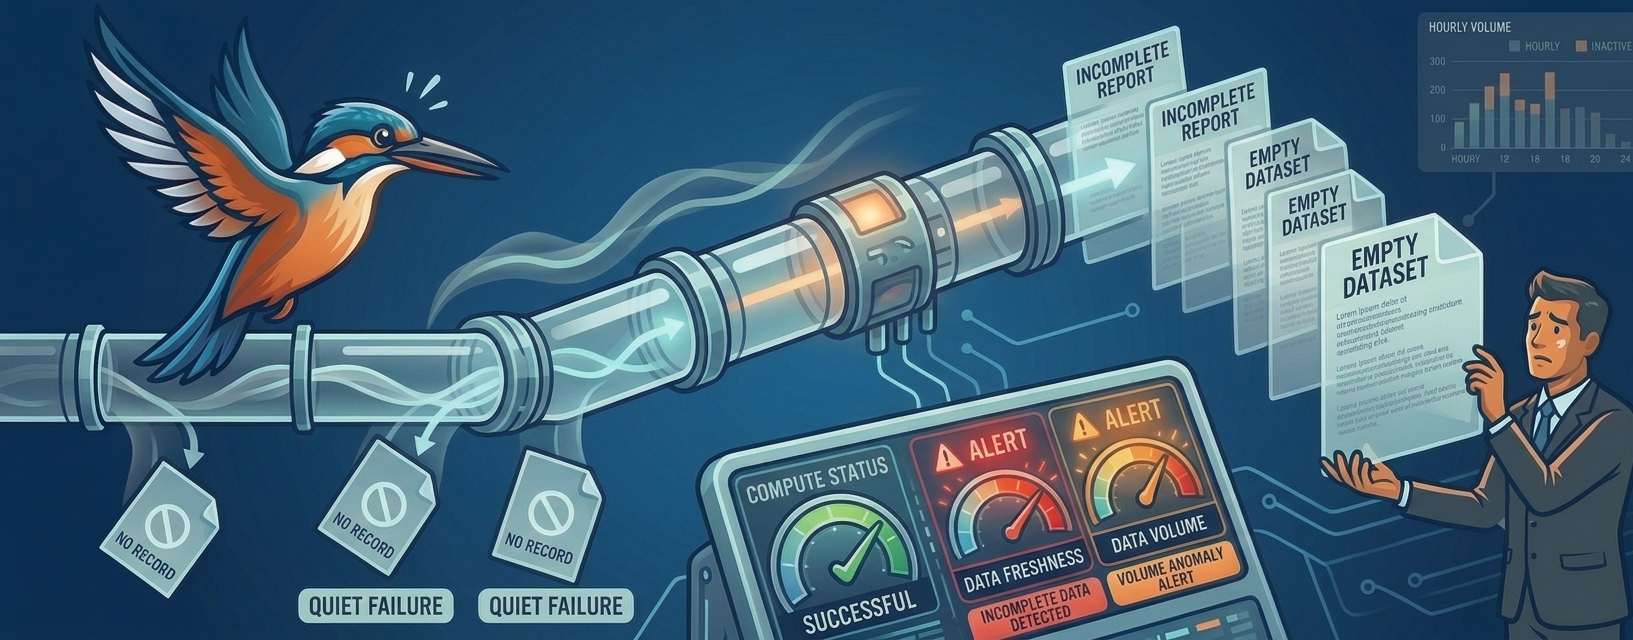
There was an ingestion pipeline that consumed change data capture (CDC) events from MongoDB, then sent them to Kafka and finally to BigQuery. This pipeline was three years old, stable, and so not closely watched by the engineering team. However, on that day, an unusual process started generating a high volume of large MongoDB documents, breaking the pipeline. The issue was interesting because the connector extracting the CDC events didn’t fail loudly. It simply stopped producing records to Kafka. Every pipeline component looked healthy: the ingestion to BigQuery was running fine while processing zero events, the DBT data transformations were successful with zero records processed, and the reports to share with third parties were also successfully generated, even though empty. There were freshness alerts on the landing tables, but they were missed amid the ocean of other alerts in a Slack channel that every engineer ignores. Then, a third-party partner raised the issue after consuming the empty reports. Everything cascaded.
This issue highlighted the lack of visibility over the ingestion pipeline. Alerts were mostly focusing on the compute components, whether they succeeded or failed, or whether there was a sudden spike in data. But none on whether we don’t have data. Many data engineering teams are in a similar situation, even though quiet failures don’t always escalate into a loud incident. Sometimes it may be a tool misconfiguration that skips records, a pipeline triggered before all files are uploaded to a Cloud bucket, or a data transformation filtering out data that shouldn’t be skipped. The result is always the same: data consumers find the data problem before the engineers do, which undermines trust.
Monitoring the absence of data
Before discussing incomplete data, the first step is to check whether the data is missing altogether. This was the first step the team decided to take after the incident: implementing freshness tests, which consist of checking when data was last refreshed in the storage layer, or when a pipeline or process last started. Even though it sounds simple, there were several considerations, such as when to trigger these tests.
At the end of a pipeline? The reporting team wanted to choose this option for the report-generation pipeline. More than a freshness test, it was a reconciliation check. Ensuring the row count in the report matches the source system’s row count. Ultimately, it was decided to reconcile against another upstream dependency, as this reconciliation pattern the data engineering team didn’t want to maintain. Reconciliation should be done by the ingestion pipeline, not by the data consumers.
Instead, the team was encouraged to check the data freshness at the beginning of the pipeline. Checking whether the required data is available before generating the reports. If not, interrupt the flow and raise an alert. That was a better pattern for the consumers. However, the ingestion issues would still be raised when the reports must be generated, putting pressure on the engineers.
Therefore, freshness tests were also configured to run on a schedule. This works well for continuous pipelines to ensure work is still happening, and also to decouple a pipeline from the test. Because if the pipeline didn’t trigger at all, neither of the two previous options would raise an alert. However, data flow doesn’t always have an obvious pattern. In our case, data throughput was high for several hours, then low for a couple of hours. The risk was to have too many false alerts. A longer-term resolution was to develop a volume-based anomaly detection tool to have smarter alerts than “data must have been refreshed every three hours”.
Another action item was to build a dashboard that shows the hourly data volume for all landing tables. It was not an alerting mechanism. The idea was to visualize ingestion drops during data investigations quickly. However, as with most things useful only in bad times, people stopped using the dashboard after a few weeks and forgot about it.
The harder problem
Implementing a volume-based anomaly detection algorithm is not as straightforward as it sounds. Yes, algorithms exist, and if you use tools like DBT, there are packages available for them. But implementing a smart solution can be challenging. Avoiding false alerts is critical because once the team loses confidence in the quality of the freshness tests, it stops watching them. So, engineers must build trust in the tooling, which is why monitoring all the tables in a data warehouse isn’t a good solution either. Alerts on non-critical tables that do not require tight SLAs and are not as reliable will hide the important ones. For us, the initial idea was to have a centralized tool that monitors freshness for every team, but due to these constraints, the data engineering team implemented shared tooling and pushed responsibility to the data owners. They were the ones who had to decide which tables they own should be monitored for volume anomalies and to prioritize their implementation in their backlog.
Several months later, tooling was ready, guidelines for data teams were updated, some critical tables were finally monitored, and others were not. It can be frustrating to think that the incident could repeat despite the lessons learned. That's the cost of distributed data ownership.